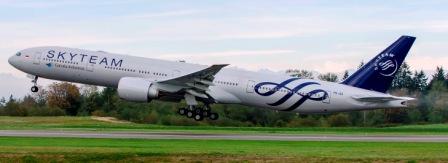

Jet Airways, the Indian airline based out of Mumbai, Maharashtra, has released it figures for the quarter ending June 2012. The airline operates over 400 flights daily to 76 destinations worldwide, while it has codeshare agreements with, Air Canada, Alitalia, All Nippon Airways, American Airlines, Brussels Airlines, Etihad Airways, Emirates Airlines, Gulf Air, Kenya Airways, Malaysia Airlines, Qantas, United Airlines and Virgin Atlantic Airlines.
Summary Jet Airways and Jetlite (combined):
First Quarter (Q1) Financial Year (FY) 2013
- Jet Group Q1 FY13 total revenue (combined) of INR 52,748 million (US $ 948.5 million); up by 31.4% year-over-year (YoY)
- Jet Airways (domestic) yield up 8.9% YoY; JetLite yield up 43.2% YoY
- Q1 FY13 passenger growth of 10% in domestic versus same period last year (Industry passenger growth of 1%)
- EBITDAR [3] of INR 8,255 million (US $ 148.4 million) for Q1 FY13 vs INR 3,330 million (US$ 74.5 million) in Q1 FY 2013; up 147.9% YoY
- EBITDAR margin [4] of 16.0% vs. 8.4% in Q1 FY 2013.
Highlights for quarter ended June 30, 2012 versus June 30, 2011 – Jet Airways (alone)
Operational
- System-wide ASKMs [1] of 10,285 million, up 10.4%
- System-wide RPKMs [2] of 8,502 million, up 16.3%
- System wide seat factor of 82.7% versus 78.5%
- 4.86 million revenue passengers carried, up 19.5%
Financial
- Revenue INR 47,116 million (US $ 847.2 million) versus INR 35,824 million (US $ 801.4 million); up 31.5%
- Fuel INR 19,674 million (US $ 353.8 million) versus INR 15,637 million (US $ 349.8 Million) in Q1 FY12; up 25.8%
- EBITDAR [3] of INR 7,395 million (US $133.0 million) in Q1 FY13 versus INR 3,477 million or (US $77.8 million) in Q1 FY12; up 112.6% YoY
- EBITDAR margin [4] at 16.1% in Q1 FY13 versus 9.8% in Q1 FY12
- Profit before tax INR 333 million or (US $ 6.0 million) versus Loss of INR 1,568 million or( US $ 35.1 million); turnaround of INR 1,901 million
- Profit after tax INR 247 million or (US $ 4.4) million versus loss of INR 1,232 million or ( US $ 27.6 million)
Highlights for the quarter ended June 30, 2012 versus June 30, 2011 – JETLITE
- Achieved seat factor of 79.3% in Q1 FY 2013 versus 80.1% in Q1 FY 2012
- Total revenue INR 5,632 million (US $ 101.3 million) versus INR 4,321 million (US $ 96.7 million) for Q1 FY’12; up by 30.3% YoY
- EBITDAR [3] of INR 860 million or (US $ 15.5 million) in Q1 FY13 versus a negative EBITDAR of INR 148 million or (US $ 3.3 million) in Q1 FY12
- EBITDAR margin [4] at 15.4% in Q1 FY13 versus negative EBITDAR margin [4] of 3.4% in Q1 FY12
- Profit before tax INR 117 million or (US $ 2.1 million) versus loss of INR 52 million or (US $ 1.2 million)
- Profit after tax INR 117 million or (US $ 2.1 million) versus loss of INR 53 million or (US $ 1.2 million)
Management Discussion and Analysis (for the quarter)
According to Jet Airways, for the quarter in question, severely depreciating rupee against dollar, ever escalating aviation turbine fuel prices (ATF) and the imposition of levies and charges on account of improved infrastructure at Delhi T3 Airport, has resulted in an increase in operating costs.
However, yield improvement coupled with increase in demand and stringent cost control measures has helped Jet Group to post profit after tax of INR 364 million (US $ 6.6 million).
Q1 FY 2013 saw an increase of around 13% in fuel rates (over Q1 FY 2012), which already had a high base last year. The result also includes an amount of INR 1,703 million or (US $ 30.6 million) on account of foreign exchange (FX) translation losses [realised FX loss of INR 1,160 million (USD $ 20.9 million) and unrealised FX loss of INR 543 million (USD $ 9.8 million)], which has impacted the overall results.
Jet Group continues to maintain its position in the Indian aviation industry with the market share of 27.9 % for the quarter ending June 2012.
Nikos Kardassis, Jet Airways (India) Ltd's chief executive officer, said, “Fuel cost increase and depreciation of the Indian Rupee vis-à-vis the US Dollar weighed heavily on the industry's profitability. In fact, the ATF prices per litre were up by 13% vs. Q1 FY12 and up by 3% vs. Q4 FY 2012.
“Crude oil prices have since come off the highs of US $ 120 per barrel and now range between US $ 100 – 105 per barrel (Brent crude). However, benefits of the same have not accrued due to the depreciation of the Indian Rupee, which has decreased from levels of Rs. 44.70 in Q1 FY 2012 to Rs. 55.615 in Q1 FY 2013, an increase of around 24.4%, which has also put pressure on our dollar denominated costs.
“Despite having a natural hedge because of our US $ denominated earnings, we had to recognize FX losses to the extent of INR 1,703 million or (US $ 30.6million) for the quarter on account of such exchange rate fluctuation.
“The industry has been going through a turbulent time over the last few quarters due to high costs and an excess capacity environment, which has caused financial strain on airlines. Going forward, we do not expect any major capacity increase given the delivery schedules of airlines in the sector.
“As India's premier airline, we continue to strive in our endeavor to enhance our guest experience through various strategic marketing and customer friendly initiatives. This will help us to achieve customer delight, which in turn will further help Jet Airways build its industry benchmarks of service excellence and quality, with convenience and comfort.
“However, in spite all the challenges, the achievements this quarter would not have been possible without the persistent efforts, commitment and enthusiasm shown by our staff.”
Highlights of Jet Airways Domestic operations Q1 FY 2013
Domestic operations accounted for 44% of total revenues INR 20,677 million (USD 371.8 million). Revenues were up by 33.7% year-over-year (YoY). Revenue per RPKM (yields) were up 10% vs. Q1 FY12 and by 8.6% vs. Q4 FY 2012.
Domestic traffic for the Jet Airways Group grew by 10% for the quarter versus same period last year. As against this, industry traffic grew by 1%.
Passenger Load factors for Jet Airways Domestic operations was 76.2% for Q1 FY 2013 and Capacity in terms of ASKMs was 3,705 million which is up by 15.2% versus Q1 FY12.
Highlights on International operations Q1 FY 2013
International operations accounted for 56% of total revenues INR 26,439 million (USD 475.4 million). International Revenues were up 29.8% vs. Q1 FY 2012 on account of strengthening yields. Our evenue per RPKM on the international flights went up by 21.2% YoY.
The airline achieved seat factor of 86.3% in Q1 FY 2013 versus 80.5% in Q1 FY 2012.The EBITDAR margins are at 17.0% in Q1 FY 2013 versus 11.2% in Q1 FY 2012 despite higher fuel costs and depreciating Indian Rupee.
For the quarter, international traffic grew by 20.4% for the quarter versus same period last year.
Outlook
High crude prices, rupee depreciation and slow down in economy will impact the operating margins in short term. Imposition of higher user charges and levies at Delhi T3 Airport will lead to airline passing on the costs to passengers, which in turn may affect the passenger growth and / or ability of the airline to increase fares.
Second Quarter (Q2) domestic traffic trends will reflect seasonality in seat factors though yields continue to be strong. The industry capacity growth is expected to be very modest (less than 5% for the year) and this will result in overall yields and seat factors remaining stable for the balance part of the year.
International loads continue to be strong for the second quarter reflecting high seasonality.
The airlines efforts to reduce costs (ex-fuel), including route rationalisation, contract renegotiation, productivity improvements will help them to improve operating margins and these have started showing. The cost per ASKM [1] (ex-fuel) has remained flattish despite an increase in return on equity (R.O.E) of approximate 24% YoY.
According to the airline, they intend to strengthen their balance sheet by bringing down the debt burden by around US $ 400 million during the financial year through various initiatives.
Jet Airways have completed sale/ sale and lease back of 2 aircraft and 2 engines in Q1 FY 2013. During the second quarter, the airline intend to complete transactions for another 8 – 9 narrow body aircraft. This has/ will help in reducing on balance sheet debt and release cash.
The airlines' focus on ancillary revenues has started to show improved results. Initiatives relating to passenger and non passenger ancillaries will start forming a large part of our top line in the next few quarters, by when they plan to increase our ancillary revenues per passenger by 100% of what they are making today.
[1] ASKM (Available Seat Kilometre) – Passenger seat capacity measured in seats available multiplied by the distance flown.
[2] RPKMs (Revenue Passenger Kilometre) – Number of passengers carried multiplied by the distance flown.
[3] EBITDAR – Operating profit before depreciation, amortisation and aircraft operating lease rentals.
[4] EBITDAR margin – EBITDAR expressed as a percentage of the sum of revenue and other operating income.
Exchange rate used 1 US $ = INR 55.615 for current quarter and 1 US $ = INR 44.70 for previous year same quarter